
Estimating Manufacturing-Related Workplace Injury Risk

In health, it is helpful to be able to estimate average risk, or probability, of death, disease, or some injury. In our case, our collaborators wanted to assess how likely factory workers are to develop carpal tunnel syndrome (CTS). Over a six-year period, data was collected on 429 workers from ten different Midwestern manufacturing facilities, measuring age, Inflammatory Arthritis, body mass index (BMI), hobbies, number of musculoskeletal disorders (OMSDs) other than CTS, depression level (never, often, seldom, always), and strain index (SI). The SI level was created based on the force, repetition, percent duration of exertion, posture, speed of work, and shift duration that a factory worker experienced while on the job1. Many times, injured workers will require larger benefits or more time off work if they are hurt, so the goal of this study is to model how the amount of strain these jobs put on workers bones and joints impacts risk. This could be helpful in preventing injury because strain is an exposure that employers can control, unlike other employee behaviors/characteristics like age, weight, hobbies, and mental health status.
The effect of these behaviors on risk can be modeled using the Cox proportional hazards3 regression model, which is the standard choice for this type of analysis (see Figure 1). However, the model must be assessed to determine if it properly fits the data. The initial check of model assumptions showed signs of deficiencies on the assumption that relative risks are independent of time (called the Proportional Hazard Assumption). The graphs of the residuals for the BMI coefficient appeared to decrease over time (see Figure 2). Residuals calculate the difference between what the model predicts the BMI coefficient would be and what was actually observed in the dataset. The residual graph should be a horizontal line, and similar deficiencies were observed for the 1-2 other musculoskeletal disorders variable2.
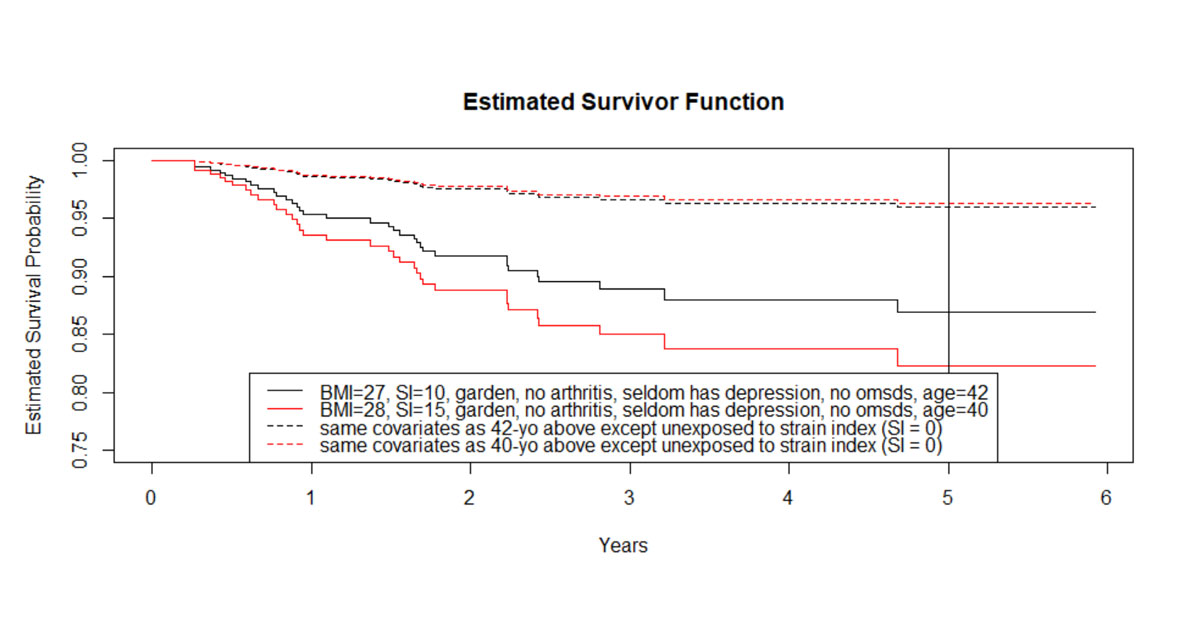
Figure 1: Initial Cox Proportional Hazards Model. Each combination of behaviors has its own survival curve, as seen above. On average, the exposed 40-yo and 42-yo have ~82% and ~87% chance of not developing CTS respectively within 5-years (making their absolute risk of developing CTS within 5-years ~18% and ~13%).
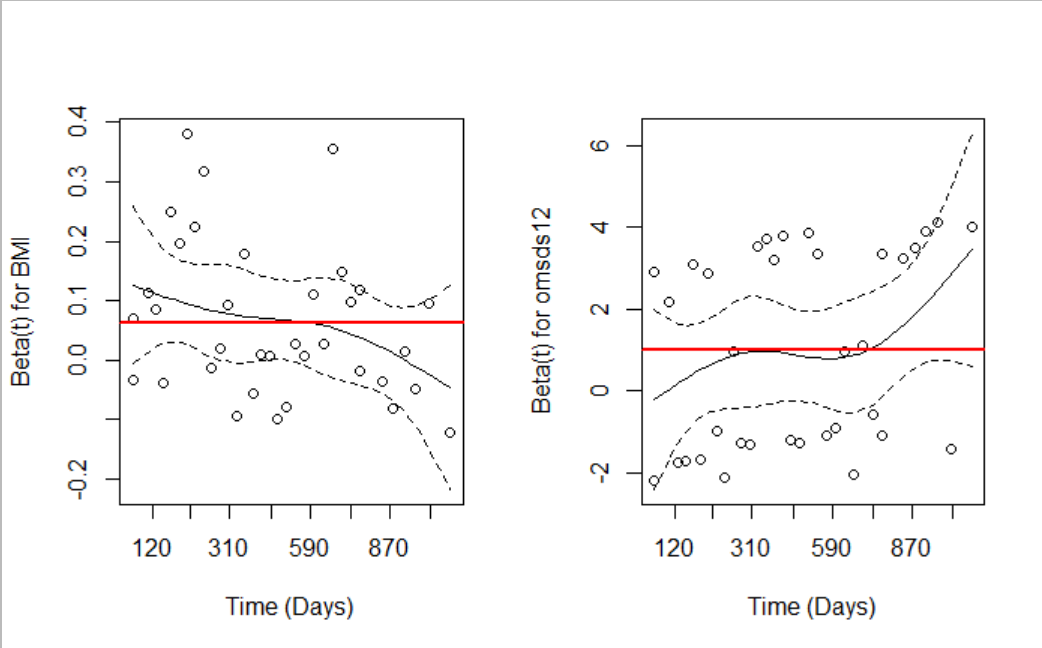
Figure 2: The graphs of Schoenfeld residuals for BMI and 1-2 other skeletomuscular disorders do not form horizontal lines, which means that time impacts how the covariates affect risk.
The tactic used to address the broken assumption was to employ a more complex model, which divides the subjects into different BMI and OMDS12 strata groups, and then fits a Cox model for each strata, meaning each group has a different average survival probability (see figure 3). This decreased the estimated absolute risk of developing carpal tunnel syndrome within five-years for an average overweight 40-year-old with no additional other musculoskeletal disorders and a ten on the strain index scale from 18% to 12% (see figure 4). While the stratification of the model had little impact on the estimated strain index coefficient of interest, there was an increase in effect of arthritis and a decrease in effect of depression, on average. This study shows the importance of checking model assumptions and investigating alternative modeling techniques. Incorporating this information into the risk model for CTS allows for more tailored risk calculations and applications of risk scores.
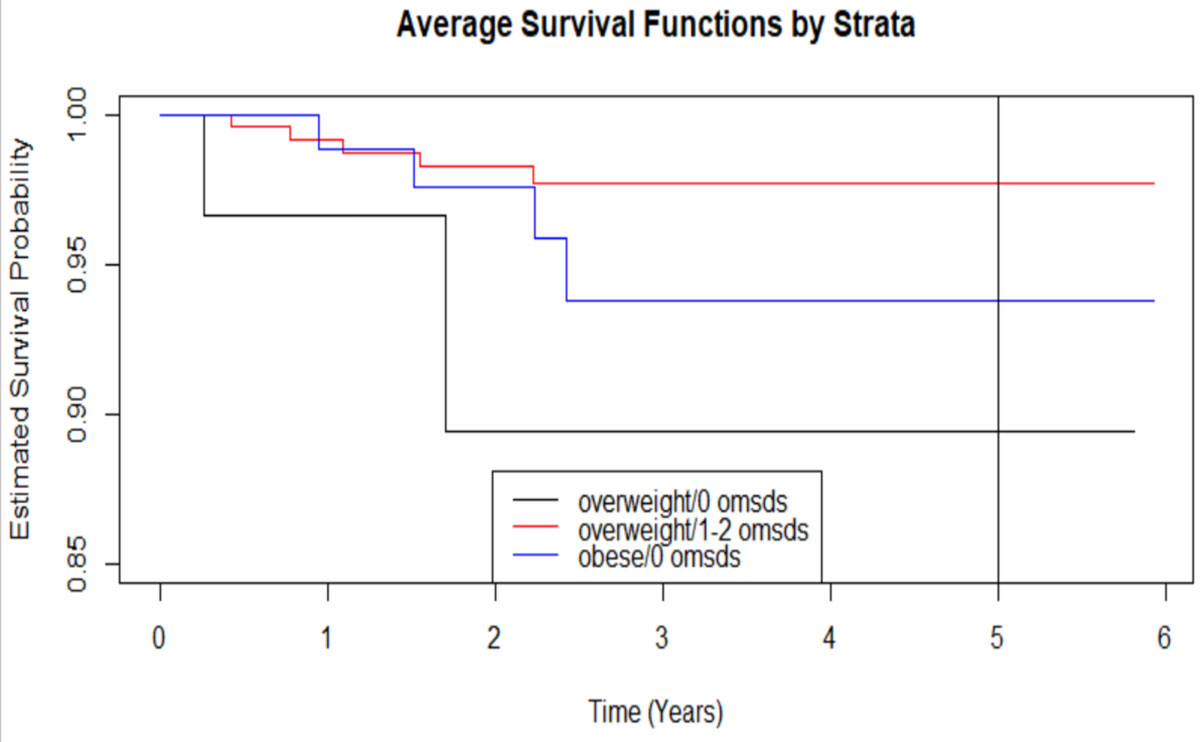
Figure 3: Three of the nine strata of the new model are seen here. While the coefficients for each strata stay the same, each group has its own baseline hazard that contributes to risk.
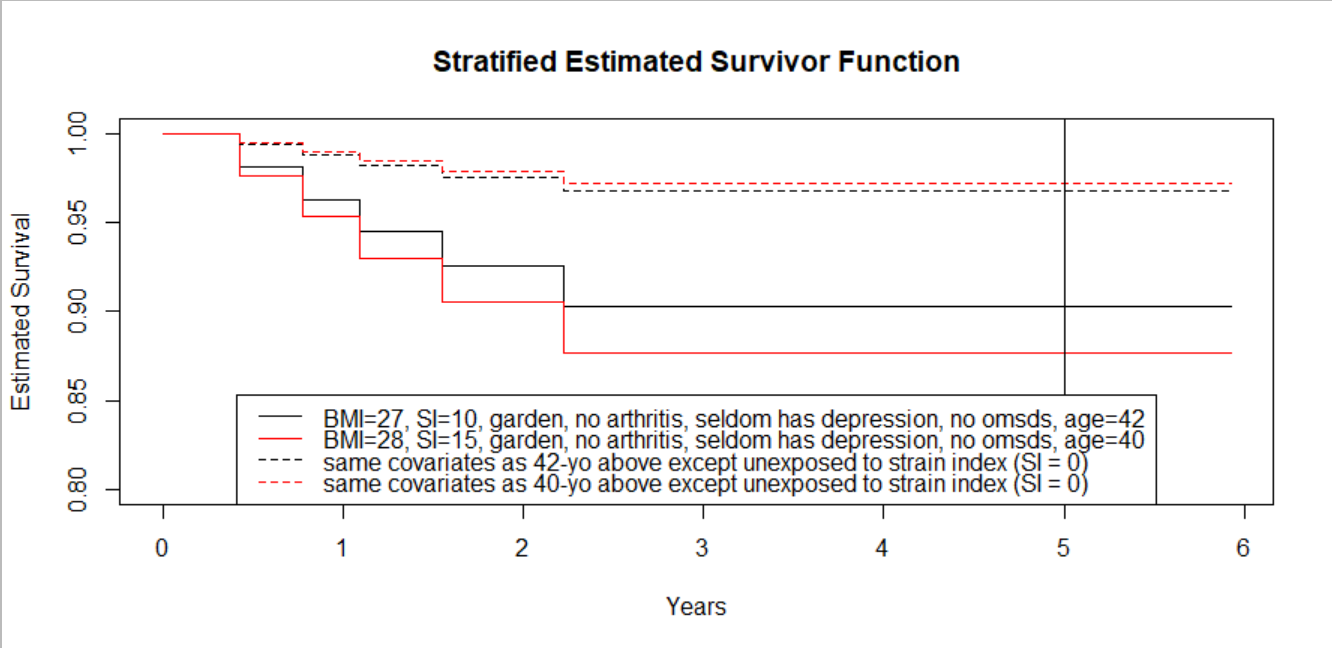
Figure 4: New survival curves based on the stratified Cox model. The 40-yo and 42-yo are in the overweight/no OMSDS strata, and from their new survival curves their chance of not developing CTS increased compared to the previous model (now ~88% and ~90% respectively). The difference between the chance of not developing CTS for the 40-yo compared to the 42-yo decreased by 3%.
This article was written by Hannah Fuchs in joint work with Elizabeth J Malloy and Jay M. Kapellusch.
References:
Garg A, Kapellusch J, Hegmann K, Wertsch J, Merryweather A, Deckow-Schaefer G, Malloy EJ, and the WISTAH Hand Study Research Team. The strain index and TLV for HAL: Risk of CTS in a prospective cohort. Ergonomics 2012; 55:396-414.
Collett DA. Modelling Survival Data in Medical Research. Boca Raton, FL: Chapman & Hall/CRC Press, 2003.
Cox, D.R. (1972). Regression models and life tables (with discussion). Journal of the Royal Statistical Society, B, 74, 187-220.