
City Trees and The Urban Heat Island Effect
It’s called the urban heat island effect. Cities are hotter than their surrounding rural areas because they have removed vegetation and replaced it with pavement and buildings. As global warming continues, cities become home to extreme temperatures, which pose health issues for its residents, particularly the most medically and economically vulnerable.
One way that cities combat heat is through installation of green infrastructure including, most notably, tree planting. Washington, DC, like many east coast cities, was originally carved out of forest. The tree species that exist in the city reflect that history. Rock Creek Park is dominated by beech trees, but the streets of DC are lined with maples, oaks, and elms. Not all tree species react in the same way to increased heat or to the other perils of urban street tree life. It is with this in mind that I set out with Avery Williams (MS environmental science ’21) and Yuemeng Gao (MS environmental science ’20) to better understand how trees respond to heat and alleviate it.
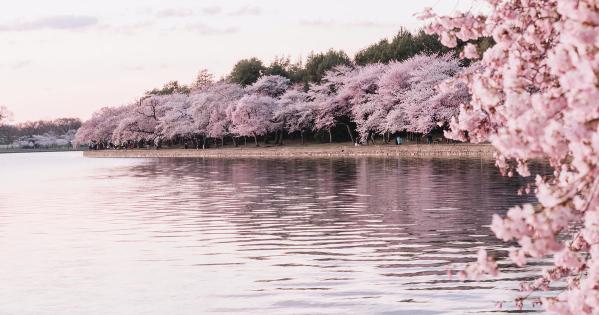
One way that trees respond to their environment is through phenological shifts. Phenology is the study of the timing of cyclical plant life stages. In DC, we follow this closely even without thinking about the word: What will be the date of the Tidal Basin’s cherry blossom peak bloom? How will that date shift if February is cold, but March is warm?
In our work, we expanded this idea to include all trees in DC. What date does the growing season (leaf development) start for trees, and when does it end (with leaf coloration and leaf fall)? Specifically, how do different species respond to their surroundings? Do maple trees have longer or shorter growing seasons if they’re planted in hotter parts of the city? What about oaks? This is important to know from the standpoint of basic ecological research and to inform future urban tree selection.
Studying tree phenology is simple but not necessarily easy. Anyone can look around in the spring and monitor the progress of leaf development. But capturing this process as data is more challenging. We have it in two ways: “phenocams” on DC residents’ roofs (the higher the better!) and weekly satellite imagery from even higher. Avery oversees the phenocams. These are security cameras that we’ve programmed to take daily photos of the same, nearby trees for months or even years on end. The literal heavy lifting of her field work was transporting cameras, mounts, and sometimes cinder blocks to volunteers’ houses around downtown DC, mostly by public transit! Every four months, she checks up on the cameras (and their caretakers), replaces batteries, downloads data, and makes sure they are still pointing at some interesting trees. Data are downloaded and analyzed with the purpose of assigning start and end of season dates to every tree in view.
While the cameras provide a rich visual depiction of seasonal change, they are limited in the number of trees they can see. To quantify subtle changes in phenology by species and planting site (e.g., amount of paved surface nearby), we needed a large sample size. This is where the satellite data comes into play. Starting with seed money from the AU Library, and followed by a grant from the National Science Foundation, we work with imagery provider Planet.com to acquire high-resolution data covering the entire city at least once a week, and on an almost daily basis during spring and fall.
We merge this imagery with maps of DC’s street trees provided by the city’s Urban Forestry Administration. After some image processing magic and statistical analysis, we now have phenological transition dates for thousands upon thousands of trees comprising 50+ species and innumerable planting conditions.
Yuemeng set the stage with maps of DC’s hot and cool spots. We wanted to know what the heat conditions were before assessing tree response. Since then, Avery and I have been conducting some simple and some more complex analyses of species’ response to heat. While we have not yet published this work, we have some early insights: Seems like the oaks are loving the heat. They develop leaves earlier and keep them on longer the hotter their planting site is. The elms are more stubborn, acting in unison, regardless of where in the city they grow. Which is the “better” response is not a straightforward answer. Longer growing seasons mean more ecosystem services (e.g., more shading, more carbon sequestration) but also means more water use. In DC, this might not be a problem, but with the speed at which the climate is changing, only time will tell.