
AU’s Latest Winter Energy Curtailment Efforts Result in Significant Energy and Cost Savings
The measurements all have been collected and analyzed and the findings it make apparent that American University’s annual Winter Energy Curtailment efforts were again an overwhelming success. In fact, during the two-week period when the campus shut down for the holidays this past December, AU reduced its emissions by 222 metric tons – equivalent to CO2 emissions from 49 cars driven for one year or the electricity consumed by 28 homes in one year. It also resulted in an $77,318 reduction in energy costs for the university.
AU’s Energy & Engineering team led the university to achieve this energy and cost savings simply by adjusting and lowering thermostats to 55 degrees Fahrenheit; turning off all non-critical lighting and unplugging non-critical equipment/appliances; closing all windows and doors; and taking other common-sense, energy-conserving actions.
“The substantial energy savings from this year’s curtailment efforts could not have been achieved without the enthusiastic support, cooperation, and participation from throughout the university community – including students, faculty, staff, Facilities Management, Housing and Residence Life,” said Juan Allen, Energy Conservation and Efficiency Manager.
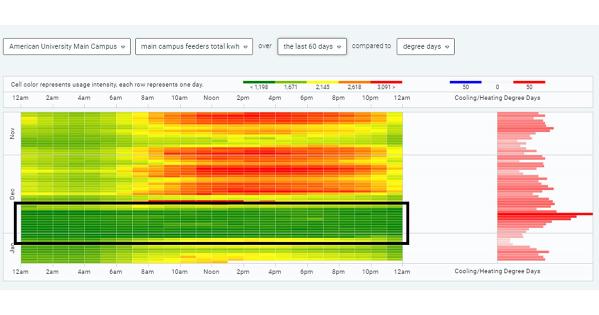
To measure the effectiveness and success of the Winter Energy Curtailment efforts, the Energy and Engineering team analyzed energy reduction through various sources, including Atrius, an energy dashboard platform, that is tied to the electric meters in each building and provides energy heat maps. Heat maps help the team gather insight on energy usage in the various buildings on campus and on how they can improve Heating, Ventilation, and Air Conditioning (HVAC) performance. Output energy usage is displayed in 15-minute intervals to give users and viewers an accurate overview of the energy consumption. Thus, the heat map is one of the most effective tools to help visualize energy usage.
Considerable behind-the-scenes preparation goes into the curtailment efforts every year, beginning a few months prior to the AU holiday break. A team of various members from Facilities Management meet to review the prior year’s curtailment and plan the upcoming year’s efforts by going over all the learned lessons. Strategically, they organize the work, schedules, staffing, and communications in close collaboration with technicians, front-line staff, and key stakeholders from Housing, Events, Sustainability, and others. Campus activities, schedules, and weather forecasts also are considered in the planning phase. At Thanksgiving break, pre-testing is done to ensure that all preparations have been made for the winter break curtailment. In early December, communications also are sent campus-wide to students, staff, and faculty, urging them to take energy-conserving actions to help make the initiative successful.
“One of the Energy and Engineering team’s jobs is to develop and implement proven energy efficiency and conservation practices. The all-hands Winter Energy Curtailment initiative is just one of the ways we work with the university community to help reduce AU’s energy consumption and carbon footprint,” said David Osborne, Director of Energy and Engineering
Note: An update was made to the original version of this story to reflect the correct reduction of emissions and its equivalence to the amount of electricity consumed
